Electricity up 8.76%: how energy monitoring finds the waste
Eskom's tariff rose 8.76% in April, municipal tariffs rose about 9% in July, and another 8.83% is approved for April 2027. What a monitoring system can find in a building, plant or estate, what it takes to get the data, and why the numbers only pay if someone acts on them.
- Insights
- 25 October 2026
- 3 min read
Electricity in South Africa is getting more expensive again, and faster than planned. NERSA approved an 8.76% increase for Eskom's direct customers from 1 April 2026 and an average of 9.01% for municipalities from 1 July, after correcting a R54.7 billion error in its earlier decision. For April 2027, direct customers face 8.83% instead of the 6.19% approved before (Engineering News; EWN).
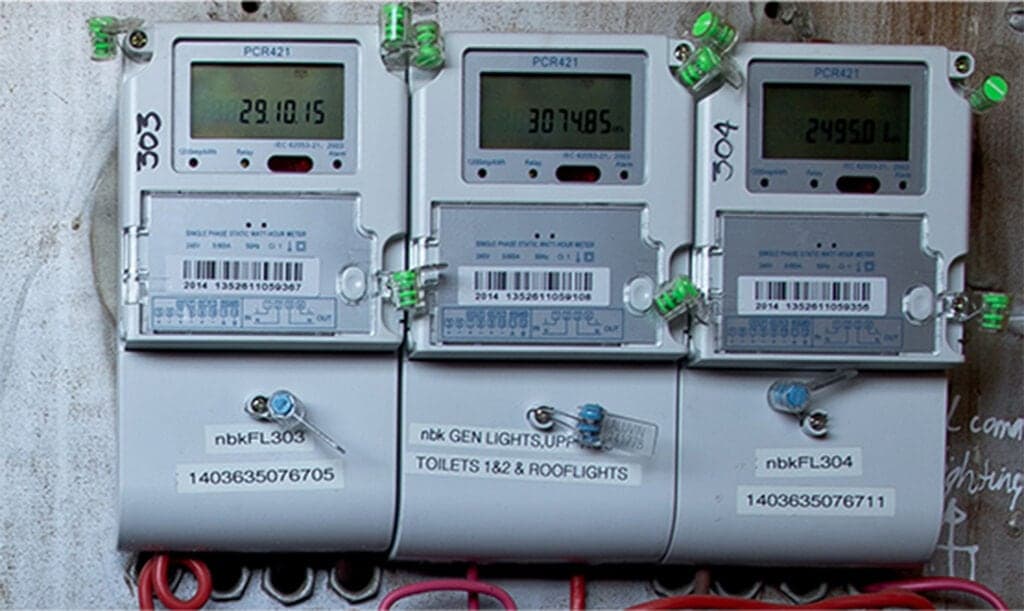
Most businesses respond the way they always have. They look at the bill, which arrives a month late, gives a total and says nothing about where the money went. Energy monitoring is the alternative: meters and sensors on the circuits that matter, reporting every few minutes, so waste shows up while it is still happening.
What monitoring finds
The night-time base load. Look at what a building draws at two in the morning, when nobody is there: compressors, chillers, extraction fans, lights in empty areas, servers nobody has checked in years. It runs every hour of every night, so a modest cut adds up quickly.
The peaks. On tariffs with a demand charge, the highest demand in the month, usually measured over half-hour intervals, can set a large part of the bill. Monitoring shows which loads start together so they can be staggered, and an alert can warn before a new peak is set instead of after the invoice arrives.
The time of day. On time-of-use tariffs, the same kilowatt-hour costs far more in peak hours than off-peak. Pumps, water heating, cold rooms and batch processes can often run at other times with no effect on the business, but only if someone can see when they actually run.
Power factor. Where demand is charged in kVA rather than kW, a poor power factor raises the bill without any extra useful work. Monitoring shows whether the correction equipment is doing its job.
Faults that look like normal use. A compressor that never stops because a door seal has failed. Two air conditioners in one room, one heating while the other cools. A geyser element running round the clock. These hide in a monthly bill and stand out as a pattern.
Solar and batteries. Many businesses installed both during load shedding. Monitoring tells you whether the system delivers what it was sold on: what it generates, how much of it is used on site, what the batteries save, and whether a fault has cut output without anyone noticing.
What the system looks like
Start with the main incomer and the five or six biggest loads, not every circuit. Split-core current sensors clip around existing cables, so a qualified electrician can usually fit them without rewiring. A small gateway sends readings every few minutes over the cellular network or the building's own connection, to a platform that stores them and shows them to the people who can act.
Add sub-meters where the first data raises a question worth answering: a tenant who disputes their share, a production line whose cost per unit you want to know, a cold room that seems to use too much.
Why most monitoring projects stall
The dashboard goes in, someone looks at it for a month, and then nobody does. The data was there. Nobody had decided what to do with it.
The fix is to decide in advance which numbers drive which actions, and who owns each one. A weekly note to the facilities manager with three numbers: last week's night-time base load against the week before, the highest half-hour peak and what caused it, and any circuit that behaved unusually. An alert to the person who can act when a peak is about to be set. A monthly cost per unit of output for the operations manager. Everything else can stay in storage until someone has a question for it.
What it is worth
Every site is different, and anyone who quotes a saving before seeing the data is guessing. What is certain is that the bill is rising by close to 9% a year, so savings compound in the same direction: a kilowatt-hour cut this year is worth more next year. For most sites, a month of data is enough to show whether there is a saving worth chasing, because it shows the base load, the peaks and the faults nobody knew were there.
If you want to see where your electricity goes, send us a brief, or write to hello@handee.co.za.
Energy monitoring
Find the waste before the next bill
Find the waste before the next billTell us what the building, plant or estate spends, and where the meters already are. We will scope the first phase.
- 01A working slice of device, cloud and dashboard, validated against real hardware
- 02Senior engineers who own the architecture and every decision
- 03An honest view on what to prove first, and what can wait
What happens next
- 01We read your briefWe come back to you with the questions that will shape the prototype.
- 02A first callWe talk through the problem, the hardware, the data and what success looks like.
- 03A clear proposalScope and cost for the prototype phase, so you know exactly what you're committing to.