Device data people can act on
Dashboards, alerts, reports and integrations that turn streams of device data into decisions.
In short
Connected devices produce a lot of data. On its own, it answers nothing. We build monitoring platforms that show the right people the right thing: live status for the operations team, trends for management, alerts for whoever needs to act and reports that prove what happened. Because we build the firmware and the cloud too, we know what every number means and where it came from.
What we build
From raw readings to clear answers
The parts of a monitoring platform, built around the questions your team needs answered.
- 01
Live dashboards
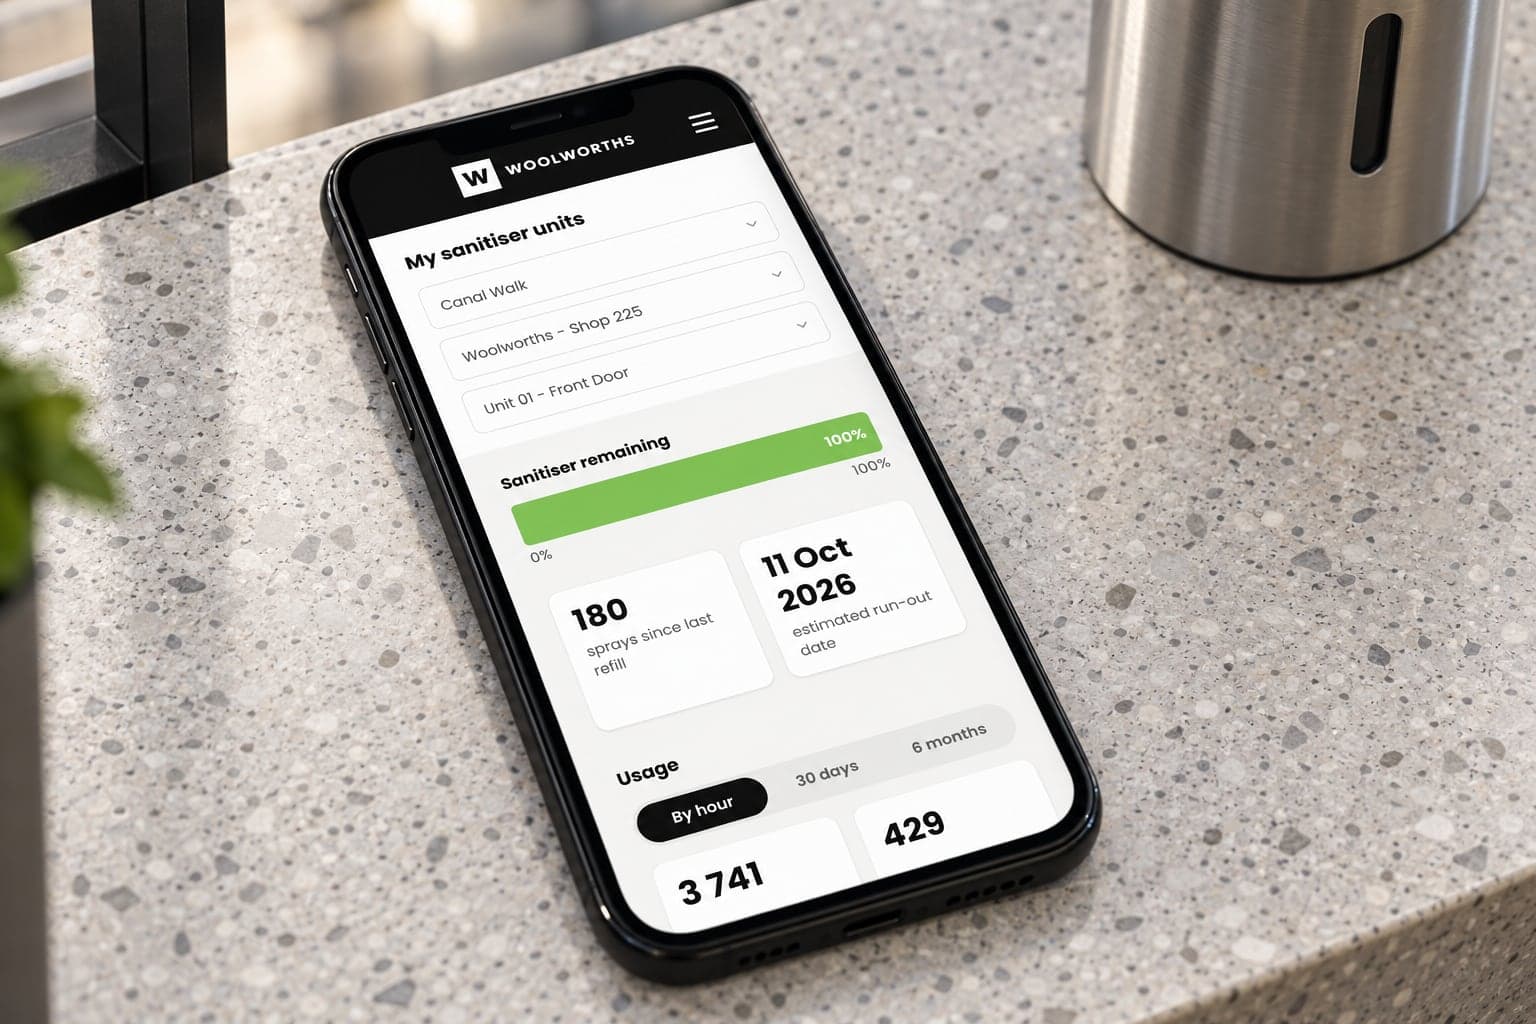
Real-time usage and online or offline status for every device, area and location, like the dashboards behind the Woolworths sanitiser stations.
- 02
Alerts and escalation
Rules that notice what matters, such as a device going offline, a level running low or a reading out of range, and tell the right person in time to act.
- 03
Trends and analytics
Usage by time of day, by site and over months, so patterns show up and decisions rest on evidence rather than hunches.
- 04
Reports
Usage and performance reports that prove what happened, for head office, a customer or an auditor, without anyone rebuilding a spreadsheet.
- 05
Integrations
Data pushed to a reporting database for any BI tool, and connections to the billing and business systems you already run.
- 06
Access by role
Each organisation, site and user sees only what they should, from a store manager's single site to head office's view of every location.
End to end
A dashboard is only as good as the data under it
Most dashboard problems start below the dashboard: readings that arrive twice, devices that go quiet without anyone noticing, timestamps nobody trusts. A monitoring platform built on someone else's data can only report those problems, never fix them.
We build the whole path. For Woolworths, that meant the stations reporting every spray, the cloud collecting it, and live dashboards showing usage and spray count per device, area and location, by time of day, alongside every machine's online status. All data was also pushed to a reporting database, so it could be interrogated with any BI tool.
Charts and maps are built with Recharts and Google Maps, on PostgreSQL and Redis, with background jobs and queues that keep up as device traffic grows.
How we build
Numbers you can stand behind
A monitoring platform is only useful if people trust what it says. These practices are built into every one.
- 01
Nothing lost, nothing doubled
Requests are idempotent and a transactional outbox makes sure no event or email is lost, so a retry never counts twice.
- 02
A full audit trail
Security events and financial movements are written to append-only logs that can be added to but never changed, so every action can be traced.
- 03
Secure by default
Passwords hashed with scrypt, sessions and tokens stored hashed, security headers on and every provider callback signature-checked.
- 04
Tested and repeatable
Hand-written database migrations with automatic drift checks, end-to-end tests with Playwright, and containerised releases that run the same everywhere.
- 05
A working dashboard in days
The prototype phase delivers cloud ingestion, a data model and a working dashboard, validated against real hardware.
- 06
Watched after launch
In the Run phase we watch fleet health and anomalies, so the platform notices problems as well as reporting them.
The Handee Method
From brief to fleet, in four steps.
Discover
We map the devices, the data they must produce, the systems they plug into and the conditions they must survive.
You get
A scoped build, a plan and a price.
Prototype
We build a working slice first: real firmware on real hardware, a live cloud and a first screen. You hold it in days.
You get
A working prototype on real hardware.
Build
We take it to production: device, cloud and apps, built in short reviewed loops, tested and documented as we go.
You get
Production firmware, cloud and apps.
Run
After launch we run the fleet: device health, anomalies, over-the-air updates and dashboards for your team.
You get
A live fleet, monitored and updated.
Related work
Platforms we've built
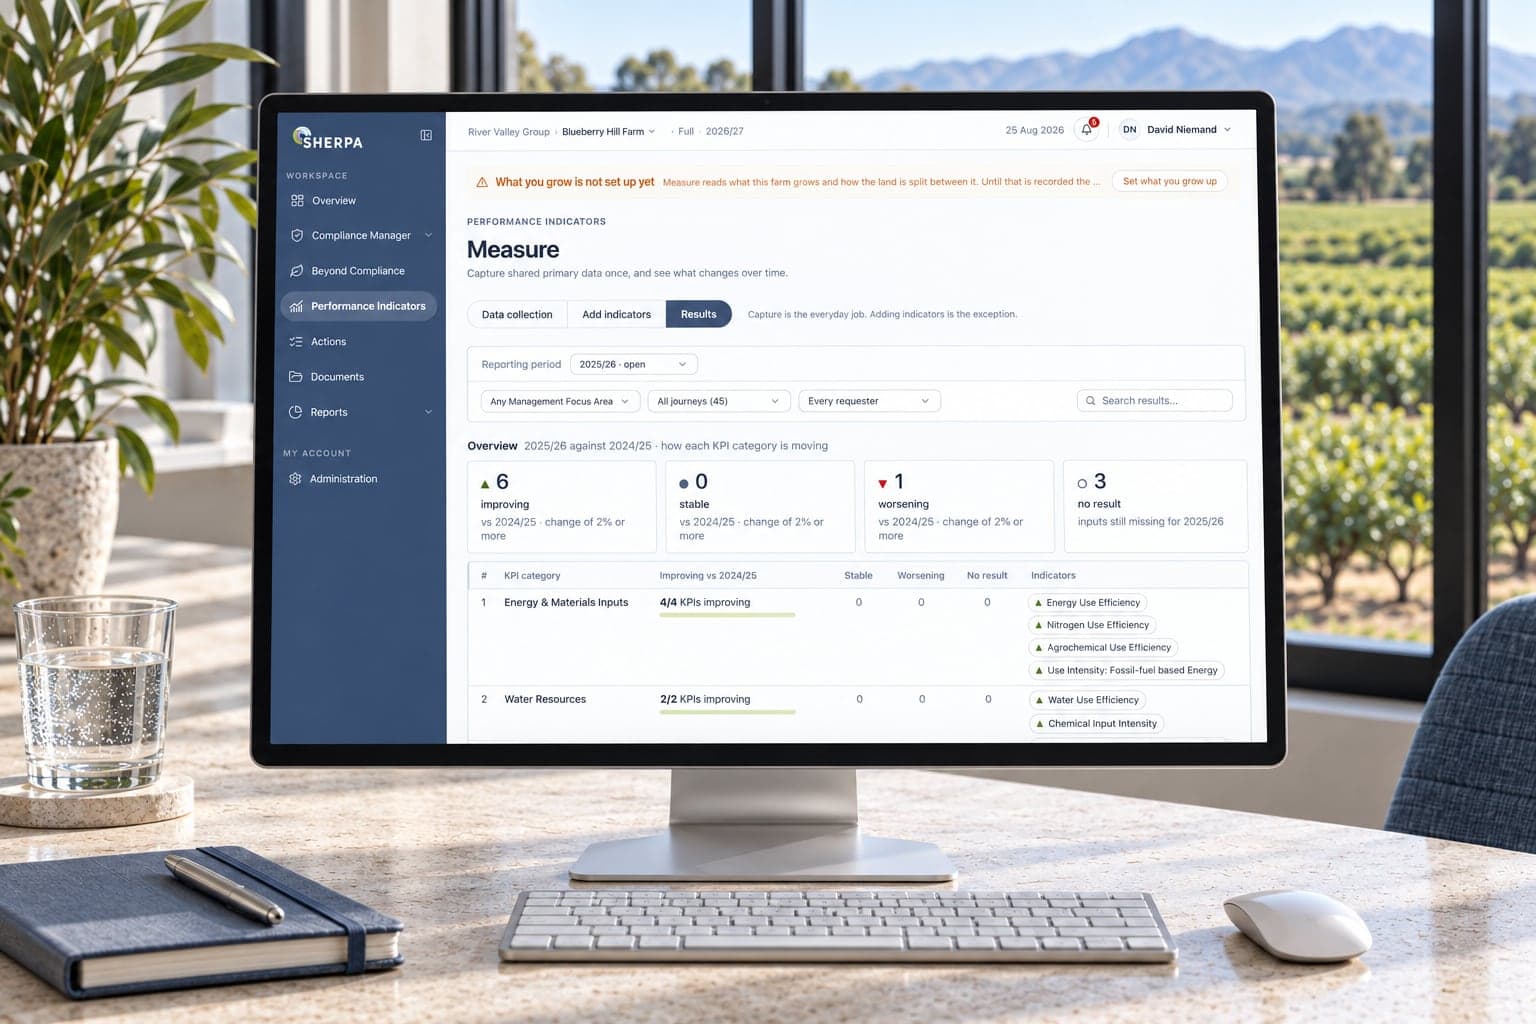
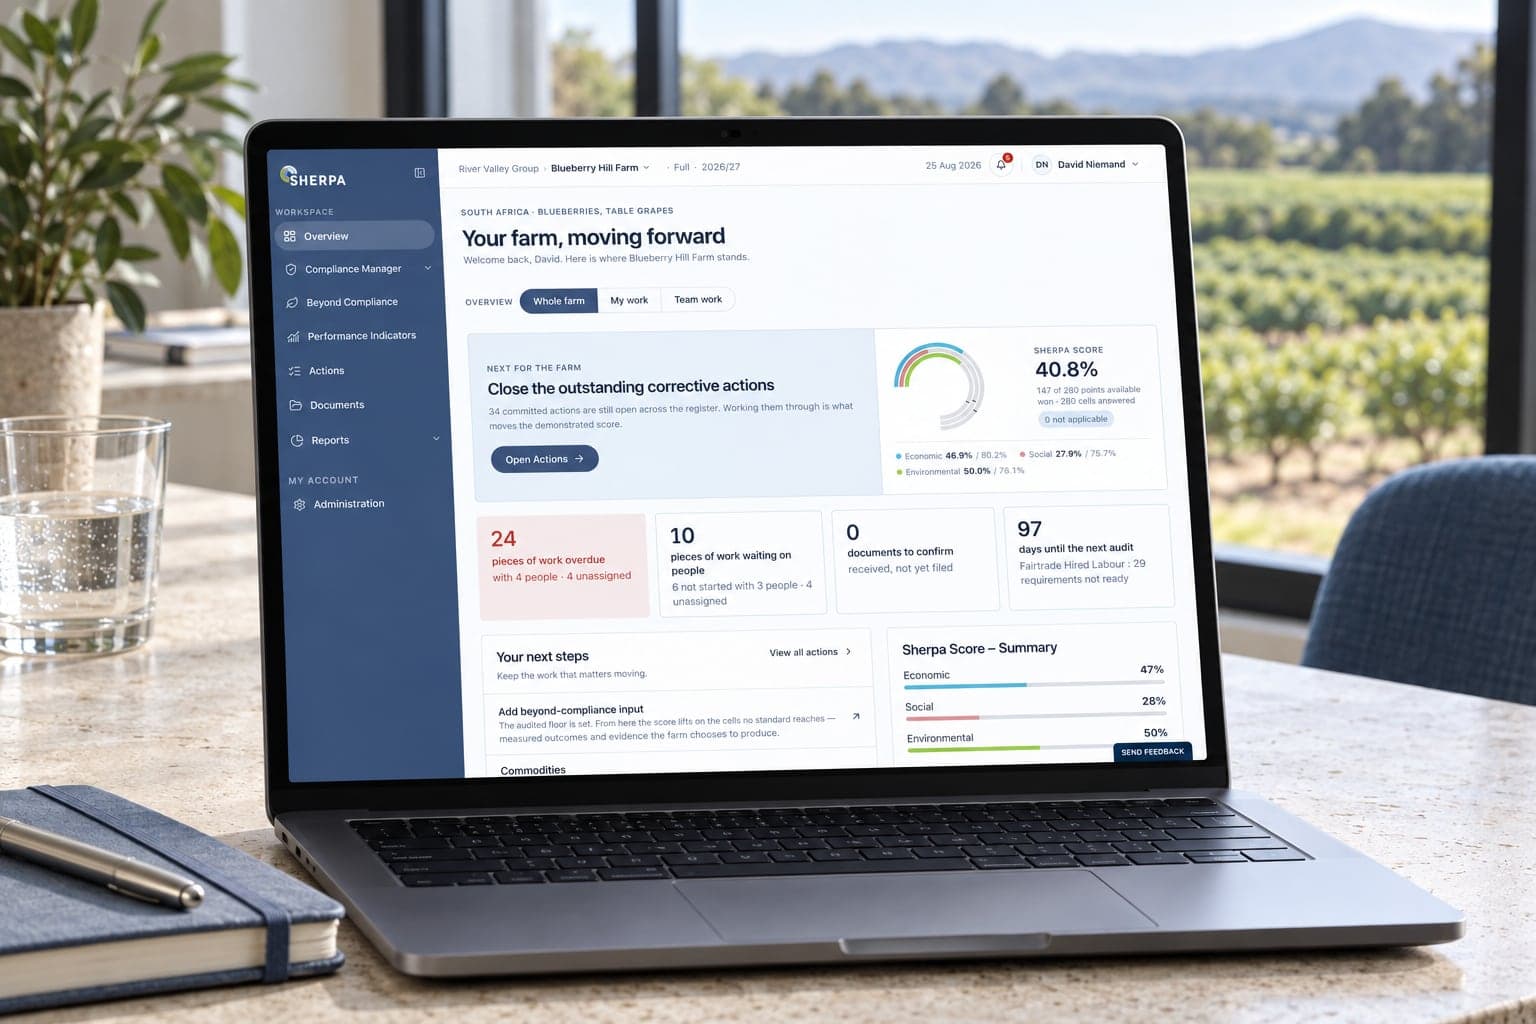
One tracks devices across stores. The other turns a farm's data into one honest score.

Your data
Tell us what you need to see
Tell us what you need to seeA few lines is enough: what devices or data you have, who needs to see it and what decisions it should drive. We'll come back with an honest view of what to build first.
- 01Talk directly to the engineers who will build it
- 02Dashboards designed around decisions, not just data
- 03A clear next step, whether or not we end up working together
What happens next
- 01We read your briefWe come back to you, usually with a few questions about your devices and your data.
- 02A first callWe talk through who needs to see what, and what they'll do about it.
- 03A clear proposalScope, timeline and cost for a first phase, so you know exactly what you're committing to.
Questions
Monitoring questions
What buyers usually ask us before a monitoring project starts.
01Do we need real-time data, or is batch good enough?
It depends on what someone does with it. An offline device or a failing pump needs to be seen quickly; monthly usage trends don't. We decide metric by metric, because real-time everywhere costs more in connectivity, processing and battery than it's usually worth. Most platforms end up with a mix: live status and alerts, with heavier reporting run in the background.
02How are alerts sent, and to whom?
To the people who can act on them, through channels they already use, such as email, push notifications or messaging. We design alerts with sensible thresholds and escalation, so a problem that isn't handled reaches someone else, and a team isn't trained to ignore alerts by being flooded with them.
03Can each customer or site see only its own data?
Yes. Platforms are built so each organisation, site and user sees only what they should, from a single store to a head-office view of every location. Access is enforced on the server, not just hidden in the interface, and security events are written to append-only logs.
04Can it connect to our ERP, billing or BI tools?
Yes, and that's often where the value lands. For Woolworths, all data was pushed to a reporting database that could be interrogated with any BI tool. We build integrations on typed APIs and signature-check callbacks from outside providers, so data moving between systems arrives once and can be trusted.
05Where is the data hosted, and what about POPIA?
We can host on AWS or Azure, both of which run data centres in South Africa, so data can stay in the country where that matters. Where personal information is involved, we'll work through what POPIA asks of your platform with you, from what's collected to who can see it. Documents that must stay private can be read on our own servers rather than sent to third-party services.
06Can we export reports?
Yes. Reports are designed with the people who read them, whether that's head office wanting proof of usage across stores or an auditor wanting evidence. They can be exported or pulled straight from the reporting database, and every figure traces back to the readings behind it.
07We already have devices and data. Can you build just the platform?
Yes. We start with what the devices send today and how, whether over MQTT, AMQP or HTTP or through a platform such as AWS IoT or ThingsBoard. If the data needs fixing at the source, we can do that too, because we also write firmware.